

Stock API OHLC Data Explained: What Do Open, High, Low, and Close Fields Represent?
When developing a stock market data system, many developers encounter a basic but important question after connecting to a stock API: what exactly do the open, high, low, and close fields returned by the API mean? For developers who are new
When developing a stock market data system, many developers encounter a basic but important question after connecting to a stock API: what exactly do the open, high, low, and close fields returned by the API mean?
For developers who are new to financial data APIs, these fields may look like simple price parameters. However, in real-world market data systems, quantitative trading platforms, and financial analysis applications, OHLC data is one of the most fundamental and important data structures.
Whether it is generating candlestick charts, analyzing historical market trends, or conducting strategy backtesting, these four fields are essential.
The stock market generates a large amount of tick-by-tick transaction data during trading hours. If every single tick is displayed directly, the amount of data becomes extremely large, making it difficult for users to quickly understand market movements.
Therefore, market data systems usually aggregate raw trading data based on fixed time intervals, such as 1-minute, 5-minute, hourly, or daily periods. The resulting aggregated data is known as OHLC data.
Simply put, OHLC uses four price points to describe market movement within a specific time period:
- Open: The price at the beginning of the period
- High: The highest price reached during the period
- Low: The lowest price reached during the period
- Close: The final price at the end of the period
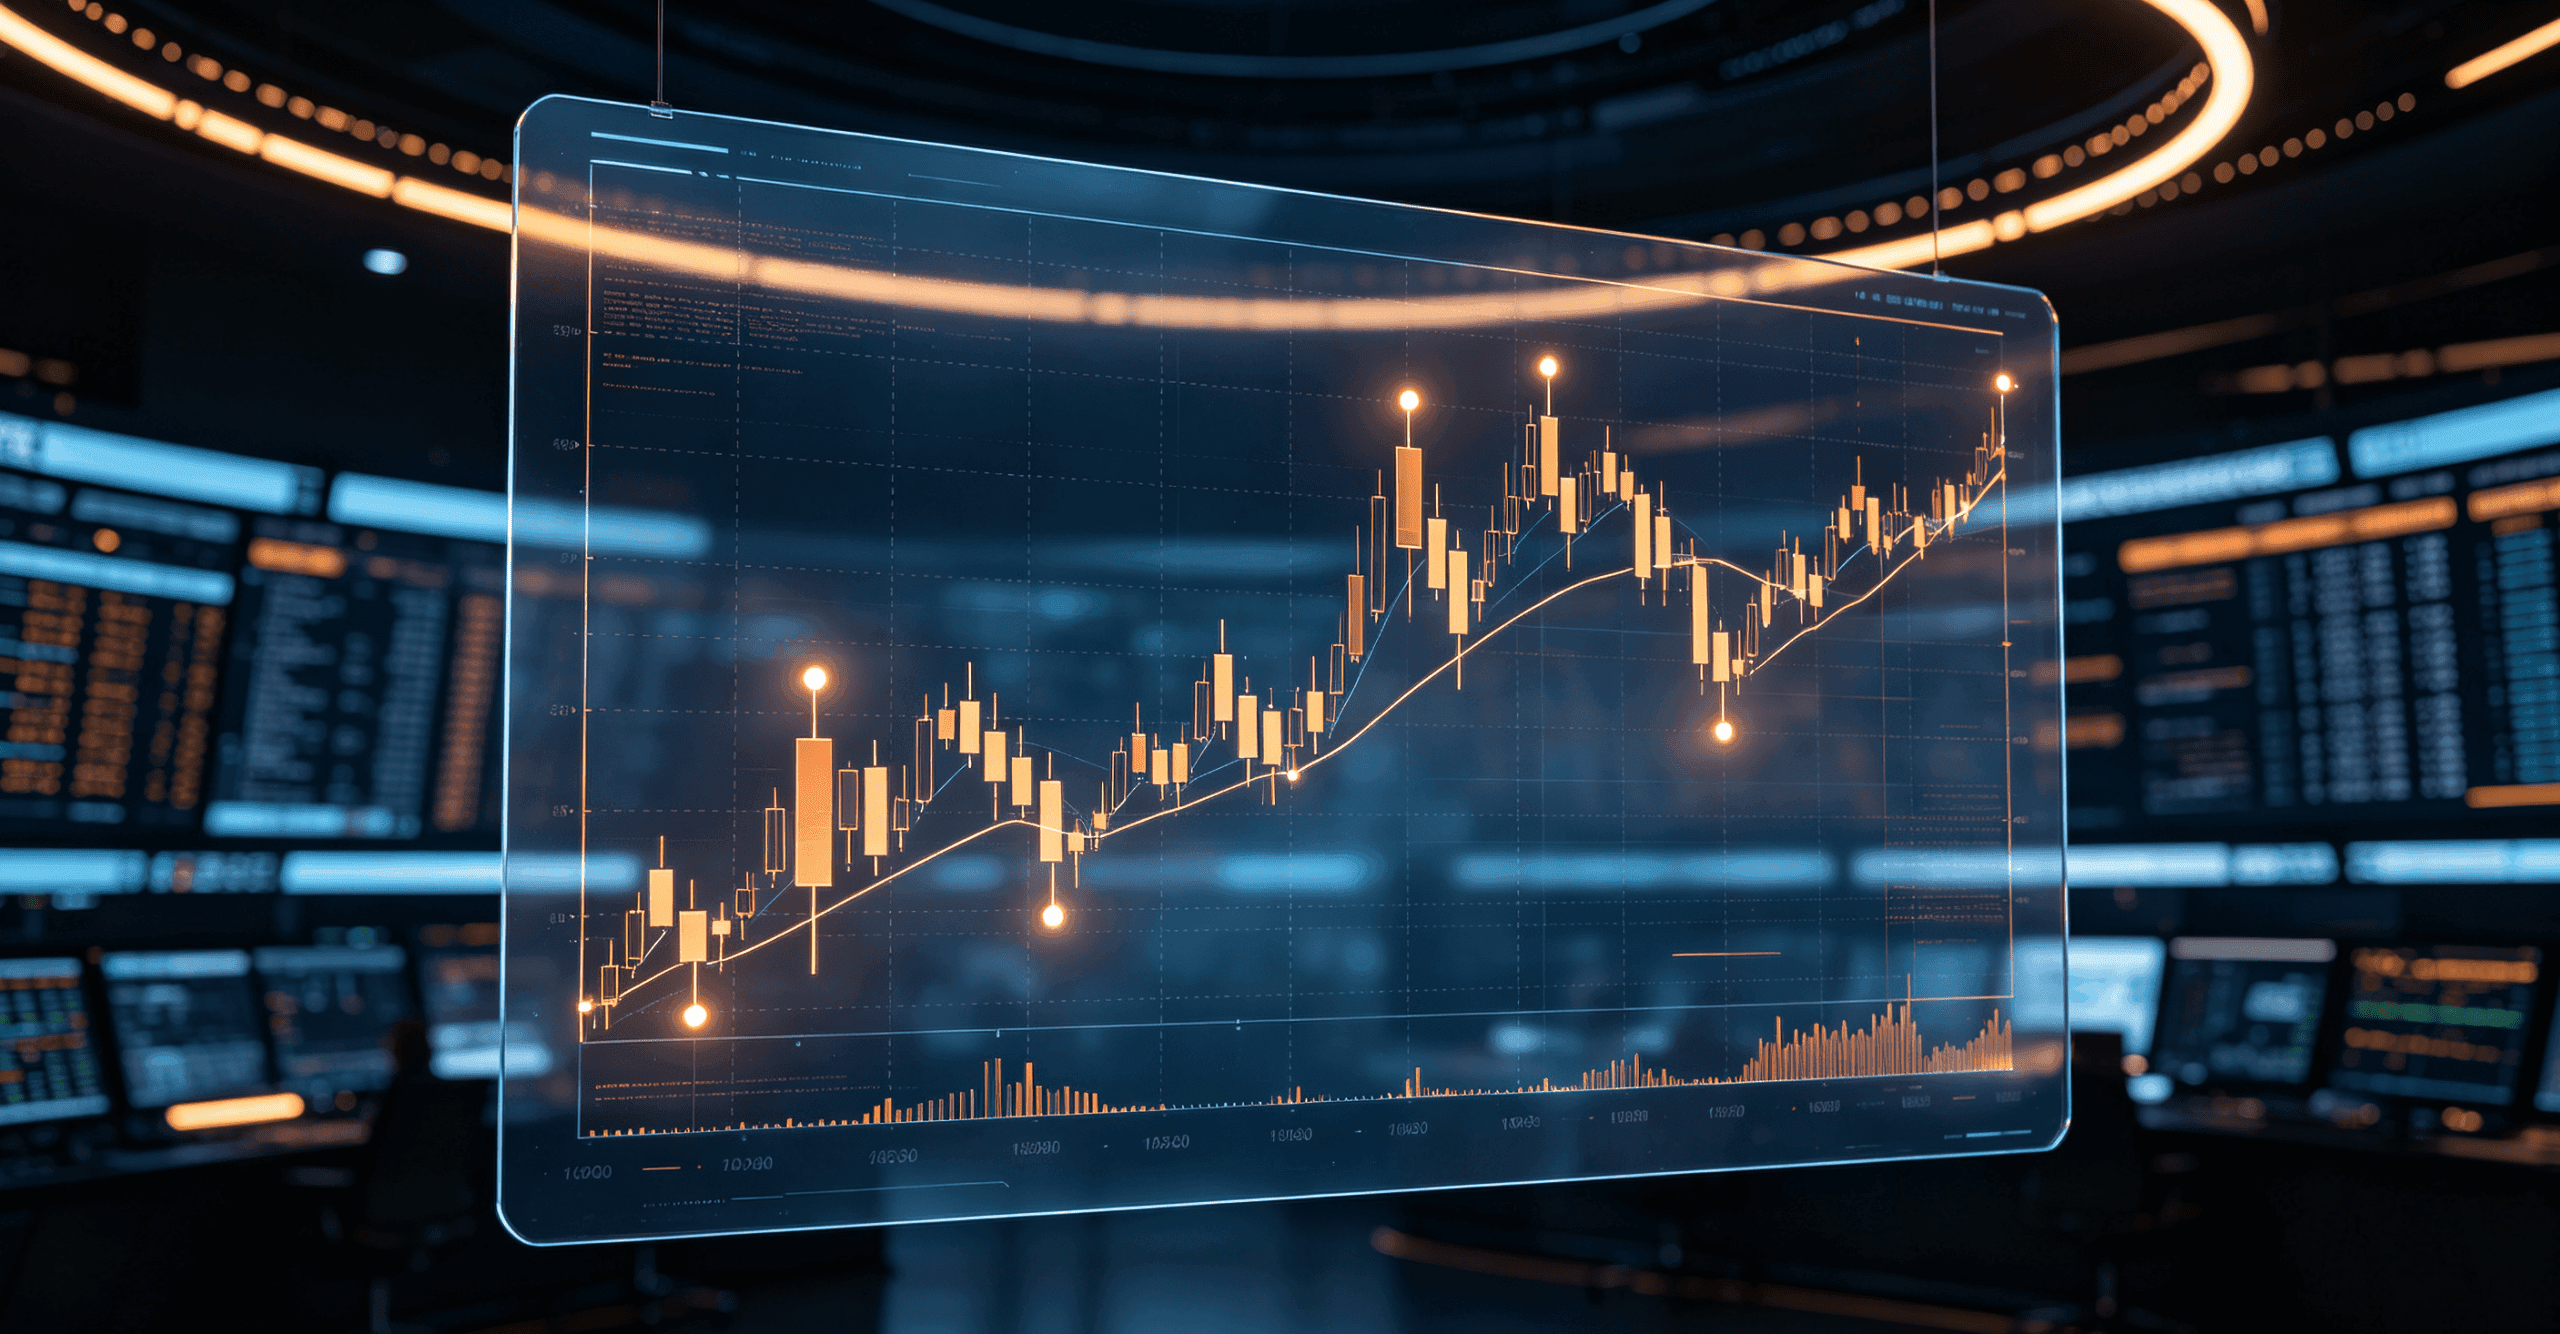
These four fields form a complete candlestick and represent one of the most common data formats returned by stock APIs.
What Does OHLC Data Returned by a Stock API Look Like?
In real-world applications, stock APIs typically return market data in a structure similar to the following:
{
"symbol": "XXXX",
"timestamp": 1784505600,
"open": 125.30,
"high": 128.60,
"low": 124.80,
"close": 127.90,
"volume": 356800
}
The meaning of each field is:
symbol: Stock symboltimestamp: Market data timestampopen: Opening pricehigh: Highest pricelow: Lowest priceclose: Closing pricevolume: Trading volume
Developers can use these fields to generate candlestick charts, analyze price movements, calculate volatility, and build additional market indicators.
Open: The Price Level at the Beginning of a Trading Period
Open represents the first valid traded price within a specific time period.
For example:
- In daily market data, Open represents the first executed trade price after the market opens.
- In a 5-minute candlestick, Open represents the first transaction price during those five minutes.
The importance of the opening price is that it shows where the market started trading during that period.
For example, after significant market news, if the stock API returns the following data:
Previous Close: 100
Open: 105
It indicates that the market experienced a significant price adjustment at the beginning of the trading session.
When developing quantitative strategies or market analysis systems, the Open field is commonly used for:
- Gap analysis after market open
- Intraday trend analysis
- Opening breakout strategies
- Price comparison between different time periods
However, different markets and exchanges may define opening prices differently.
Some exchanges determine opening prices through auction mechanisms, while some data sources may use the first executed trade as the opening price. Therefore, when using a stock API, developers should confirm how the data provider defines the Open field.
High: The Highest Price Reached by Buying Pressure
High represents the highest executed price within a specific time period.
It shows the highest level that buyers pushed the price to during that period.
For example:
Open: 100
High: 108
Low: 98
Close: 105
This means the price reached a maximum level of 108 during this period.
The highest price does not represent the final market consensus price. Instead, it records the upper limit that the market explored during trading.
In market data systems, the High field is commonly used for:
- Breakout detection
- Volatility calculation
- Historical resistance analysis
- Technical analysis data generation
For example, if the price repeatedly approaches a certain High level and then declines, that area may be considered an important price zone.
For quantitative developers, analyzing High alone is usually not enough. It is often combined with trading volume, tick data, or order book data.
If prices continue reaching new highs while trading volume increases, it may indicate stronger market participation. On the other hand, if prices rise while volume decreases, developers may need to further analyze liquidity changes.
Low: The Price Level After Selling Pressure Is Released
Low represents the lowest executed price within a specific time period.
It shows how far the price dropped when selling pressure reached its strongest point.
Similar to High, Low is not the final trading result. Instead, it represents an extreme point reached during price movement.
For example:
{
"open": 80.20,
"high": 82.10,
"low": 79.50,
"close": 81.60
}
This means:
- Opening price: 80.20
- Highest price: 82.10
- Lowest price: 79.50
- Closing price: 81.60
Low data helps developers analyze:
- Short-term price fluctuations
- Price decline ranges
- Historical support areas
- Risk management parameters
The difference between High and Low is also an important indicator of market activity.
Range = High - Low
When the price range suddenly expands, it often indicates increased market volatility. In such situations, trading systems or strategies may need to adjust their risk parameters.
Close: The Final Price Formed During the Trading Period
Close represents the last executed price at the end of a specific time period.
Among the four OHLC fields, Close is often one of the most important data points used in analysis models.
The reason is simple: it represents the final price established by the market after a complete trading process.
Many market analysis methods are based on closing prices, including:
- Moving average calculations
- Historical return analysis
- Trend identification
- Strategy backtesting
For example:
MA20 = average(last_20_close_prices)
The core data used in this calculation is the closing price from the previous 20 periods.
Therefore, if Close data returned by a stock API contains missing values, timestamp issues, or abnormal prices, it can directly affect the accuracy of subsequent analysis.
How to Use a Stock API to Obtain OHLC Data?
For developers, the most common application scenarios of OHLC data include the following.
1. Creating Stock Candlestick Charts
Frontend market applications usually require the following data:
- Time
- Open price
- High price
- Low price
- Close price
By combining these data points, developers can generate candlestick charts.
2. Building Historical Market Data Analysis Systems
Using historical OHLC data, developers can perform various types of analysis, including:
- Daily return calculations
- Volatility analysis
- Trend change detection
- Historical price distribution analysis
For example:
price_change = (close - open) / open
This calculation can quickly determine the percentage price change within a specific period.
3. Combining OHLC Data with Real-Time Market Data
In real-world trading systems, developers rarely rely only on historical OHLC data.
A more common approach is to combine multiple types of market data.
Historical OHLC data is used to understand long-term market conditions.
Real-time tick data is used to capture the latest market movements.
Level 2 data is used to obtain order book depth and liquidity information.
By combining these three types of data, developers can build more complete market analysis systems.
Data Quality Issues to Consider When Using a Stock API
Understanding OHLC fields is only the first step. In real-world development, data quality is equally important.
The first issue is time consistency.
Different markets have different trading schedules. If timestamps are handled incorrectly, candlestick periods may become misaligned. For example, minute-level data may contain duplicated or missing records.
Another important issue is stock price adjustment.
When events such as stock splits or dividends occur, historical prices may need to be adjusted.
Therefore, when conducting historical analysis, developers need to clearly understand whether they are using:
- Raw prices
- Adjusted prices based on previous prices (split/dividend adjusted)
- Reverse-adjusted historical prices
Different data processing methods can affect final backtesting results.
In addition, consistency between real-time data and historical data is extremely important.
If two different data sources are used, developers may encounter differences in:
- Data formats
- Timestamps
- Trading rules
In such cases, additional data cleaning and transformation processes are required.
How AllTick Helps Developers Handle Stock Market Data
For developers building market applications, quantitative systems, or financial data platforms, a stable data API is an essential foundation.
AllTick API provides stock real-time market data, historical candlestick data, and tick data APIs, allowing developers to access market information through a unified data structure.
By using a consistent data source, developers can reduce the complexity of:
- Combining multiple data sources
- Converting market data fields
- Synchronizing historical and real-time data
For example, a quantitative backtesting system can use historical OHLC data to validate trading strategies while combining real-time market APIs to obtain the latest market changes. This creates a complete workflow from data acquisition to strategy execution.
Understanding Market Data Through Four Price Fields
OHLC data in a stock API is not simply four price values.
Instead, it represents the complete process of how market prices changed during a specific period.
Open shows where the market started.
High and Low represent the range of price movement.
Close records the final price level established by the market.
For developers, understanding these fields is not only important for correctly parsing stock API responses, but also for building more reliable market systems, trading tools, and data analysis platforms.
When OHLC data is combined with real-time market data, tick data, and order book information, the stock market is no longer just a list of prices. It becomes structured market data that can be understood and analyzed by software systems.